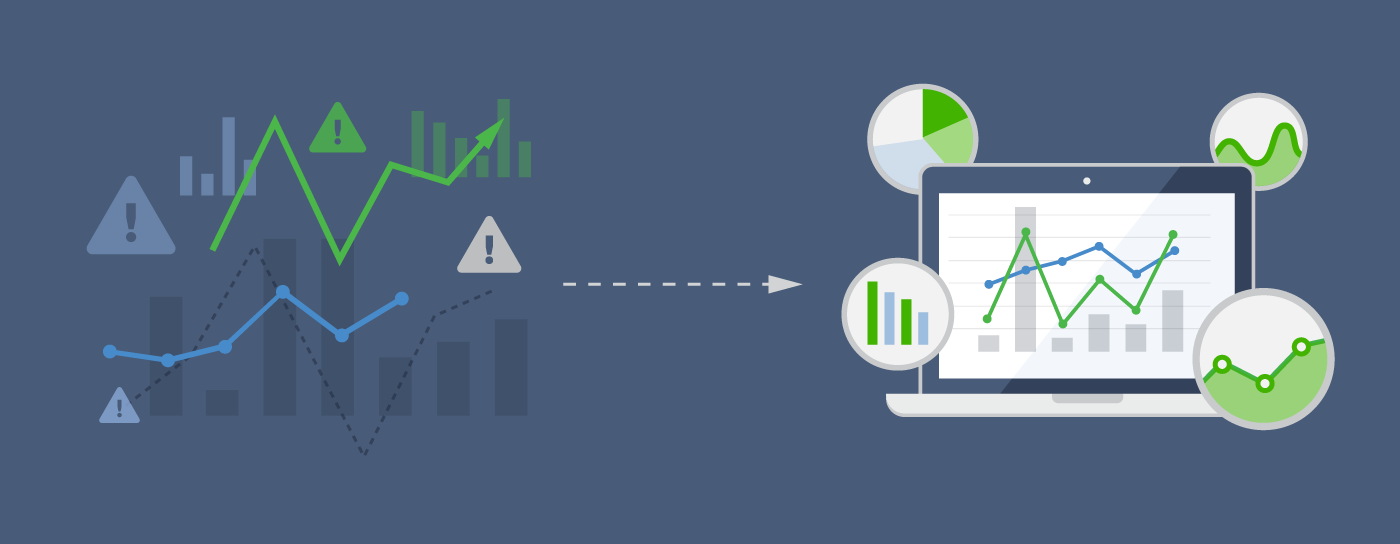
New Updates to Advanced Analytics
Advanced Analytics is now called Advanced Reporting, which includes Team, System, and User Reports. PagerDuty Analytics is a new product that surfaces the most critical trend-over-time operational insights into your people, technology, and process. To learn more, visit PagerDuty Analytics.
Discover Incident Trends and Drive Improvements
If you’re like most IT Operations teams, you’ve probably noticed that you’re now facing more incidents than ever. PagerDuty helps you manage and resolve these incidents across the entire incident lifecycle, including the critical “look back and learn” stage after problems are resolved. Analyzing incident trends is a key stage of incident management. It can help you reduce non-actionable alerts that are causing burnout and identify common alerts that are leading indicators of larger issues.
We launched Advanced Analytics last year to give teams a high-level overview of system and team performance. Today, we’re pleased to announce improvements to our reporting capabilities that enable teams to gain even greater insight. Now, teams can optimize their monitoring by visualizing metrics such as common incidents, SLA performance, and noisy incidents.
Triggered Incident Trends
Looking at incident counts over time can can give a quick sense of hotspots. However, teams need more granular reporting to surface actionable intelligence that drives significant improvements in their uptime and team efficiency. We’ve captured a few customizable reports that our new export feature lets you create. Top Operations teams have a weekly process where they review metrics just like these and discuss the implications with the team.
Most Common Incidents: Operations teams should know what their most common incidents are. Now you can get a quick view of these to support richer discussions about where recurrent problems lay.
Incident Load by Time of Day and Day of Week: Heavy alert loads can drain your team, especially if they interrupt sleep. Get a snapshot view of when your alerts are triggered, and see how many alerts are waking the team up in the middle of the night.
Incident Classification: You can create custom classifications for incidents and sort incidents by these classifications to analyze key metrics. For example, want to see your response time for critical Nagios incidents vs. just warning alerts? That’s possible.
Noisy Incidents: The System Report lets you see which services generate the most alerts, but most noise comes from alerts that quickly auto-resolve. Our new reporting functionality will let you see these incidents at a glance.
Response Trends
In addition to understanding trends in the incidents that are triggered, our reporting updates also help you understand your response trends. We recommend using these metrics for blameless retrospectives within the team about helpful process improvements.
Missed Incidents: Get a quick snapshot of the incidents that were auto-escalated due to no response.
Incidents Outside of SLA: You can also see which incidents exceeded a response time (Time to Acknowledge) or a resolution time SLA. By default, we report on a 5 min response time and a 60 min resolution time SLA, but you can easily customize the SLAs to match the ones in place for your team.
Incident Resolution Leaderboard: See how many incidents each team member resolved.
Ready to Get Started?
If you have access to Advanced Analytics, follow our step-by-step instructions to use our Advanced CSV export and spreadsheet visualization template to answer these questions and more.

