What’s New: Extending our Datadog Capabilities With New PagerDuty Widgets
In the last two years, we have seen the rise of remote and hybrid work, and with that, a proliferation of tools and apps needed to support critical communication and collaboration. Finding that app-life balance has become increasingly complex, so simplifying “how” we work is key for every organization.
This streamlining of tooling and simplifying our work process is especially true for the IT professionals and developers charged with keeping our digital systems up and running. When things break and interruptions happen, how — and how quickly — IT responds is increasingly critical. Nevertheless, jumping across screens and tabs — first your monitoring tool, then your chat app, then PagerDuty, into your homegrown application, etc. — doesn’t really help with the whole “streamline and simplify” thing.
Our goal at PagerDuty is to meet our customers where they work, whatever tool that may be, and we’re proud to have over 600 integrations with incredible technology partners. These integrations empower our customers to get more out of the PagerDuty platform and helps them define their own unique incident response processes with PagerDuty seamlessly woven into their custom technology stack.
Today we are excited to announce our latest functionality with Datadog. Our integration with Datadog serves over 3500 customers and is one of our most popular integrations. As such, the need to build upon our existing fast and effective incident response led to the development of two new widgets in Datadog. These widgets will leverage PagerDuty’s capabilities as native applications — all directly within the Datadog platform. That means you will get PagerDuty insights without the need to switch tools, screens, or tabs.
Here’s a quick overview of our new PagerDuty for Datadog widgets, just announced at Datadog Dash If you can’t wait to try it out, you’re in luck, the widgets are already available for install: just look for them in the Datadog UI extension marketplace to get started.
Status Dashboard by PagerDuty
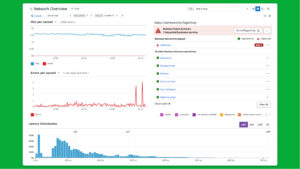
The new Status Dashboard by PagerDuty Widget provides critical visibility to improve communications between response teams and stakeholders throughout an incident. This insight provides both technical and business responders/ leaders with a real-time view of their system’s health, improving overall awareness of operational issues. The Status Dashboard will display the current service status and provide the right level of context to determine the potential impact to the business when an incident is ongoing. This provides a single-pane-of-glass for responders by providing a side-by-side view of the business services impacted with ongoing incidents all within the Datadog dashboard. You’ll be able to:
- Manually trigger an incident from the PagerDuty Datadog Marketplace to mobilize developers right away.
- Display the current status of key business services along with the impacted business services while working on incidents in Datadog.
- Improve communication between response teams and stakeholders during incidents.
Incidents By PagerDuty
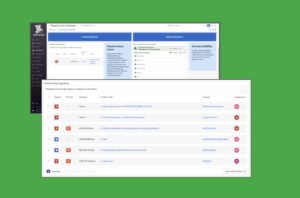
The Incidents by PagerDuty Widget will give users the ability to take incident action response actions directly from the Datadog interface. The Incident display arms responders with knowledge of ongoing incidents within PagerDuty. It also provides the ability to acknowledge and resolve from the widget, removing the need to context switch between tools, while also offering the option to seamlessly navigation back into PagerDuty for more incident details or to take further action.
Key features include:
- Display up to 20 high urgency and active incidents from PagerDuty right in the Datadog console.
- Provide flexibility for acknowledging and resolving incidents based on where responders are troubleshooting.
- Use one-click navigation to view PagerDuty incident lists, individual incident details, and services dependencies.
With these new widgets, the disruptive nature of switching from application to application will be greatly reduced for our joint customers, and users can work with the ease of knowing that all the information they need is all in one place.
To install the widgets, get all the details in our integration guide.
If you’re at Dash, check out our panel, Handling Incident Response and stop by our booth to meet our team, see a demo and get your questions answered,
Learn more about our Datadog integration here.

